Market Outlook
February 20, 2018
Market Cues
Domestic Indices
Chg (%)
(Pts)
(Close)
Indian markets are likely to open negative tracking global indices and SGX Nifty.
BSE Sensex
(0.7)
(236)
33,775
US stocks moved mostly higher but turned mixed over the course of the session. The
Nifty
(0.7)
(74)
10,378
major averages eventually ended the day on opposite sides of the unchanged line.
Mid Cap
(1.0)
(174)
16,429
The Dow Jones ended up 0.1% to close at 25,219 and the Nasdaq Composite
Small Cap
(1.0)
(179)
17,857
edged down to 0.2%, to 7,239.
Bankex
(0.6)
(163)
28,234
U.K. shares fluctuated after sharp gains last week as investors brushed aside worries
over higher inflation and interest rates. The FTSE 100 was down by 0.6% to close at
Global Indices
Chg (%)
(Pts)
(Close)
7,248.
Dow Jones
0.1
19
25,219
Nasdaq
(0.2)
(17)
7,239
On domestic front, Indian shares fell notably after the Rs 11,400cr banking fraud
unearthed at Punjab National Bank last week raised worries over the
FTSE
(0.6)
(47)
7,248
systemic and others risk management systems prevailing within the banking
Nikkei
(1.2)
(265)
21,884
ecosystem. The Sensex ended on a downside front of 0.7% at 33,775 while the Nifty
Hang Seng
0.6
174
31,289
ended at 10,378 with a downside of 0.7%.
Shanghai Com
0.4
14
3,199
News Analysis
Advances / Declines
BSE
NSE
Mahindra Group to invest Rs 9bn more into electric vehicle venture
Advances
706
392
Detailed analysis on Pg2
Declines
2,100
1,415
Investor’s Ready Reckoner
Unchanged
140
52
Key Domestic & Global Indicators
Stock Watch: Latest investment recommendations on 150+ stocks
Volumes (` Cr)
Refer Pg5 onwards
BSE
4,105
NSE
28,467
Top Picks
CMP
Target
Upside
Company
Sector
Rating
(`)
(`)
(%)
Net Inflows (` Cr)
Net
Mtd
Ytd
Blue Star
Capital Goods
Buy
726
867
19.4
FII
(135)
(6,579)
6,404
Dewan Housing Finance
Financials
Buy
547
712
30.2
Century Plyboards
Forest Products
Buy
318
400
25.7
*MFs
(139)
5,352
14,375
Navkar Corporation
Other
Buy
168
265
57.8
KEI Industries
Capital Goods
Buy
375
436
16.3
Top Gainers
Price (`)
Chg (%)
More Top Picks on Pg4
RAIN
392
7.6
Key Upcoming Events
ICIL
105
6.5
Previous
Consensus
Date
Region
Event Description
FORTIS
146
6.4
Reading
Expectations
RELIGARE
63
4.9
Feb20
Euro Zone Euro-Zone Consumer Confidence
1.30
1.00
Feb21
Germany PMI Services
57.30
57.00
UBL
1,054
4.3
Feb21
US
Existing home sales
5.57
5.62
Feb21
Germany PMI Manufacturing
61.10
60.50
Top Losers
Price (`)
Chg (%)
Feb21
UK
Jobless claims change
8.60
More Events on Pg7
PNB
116
(7.4)
UNIONBANK
110
(7.2)
NIITTECH
762
(7.2)
PCJEWELLER
354
(6.7)
SYNDIBANK
56
(6.5)
As on February 19 2018
Market Outlook
February 20, 2018
News Analysis
Mahindra Group to invest Rs 9bn more into electric vehicle venture
The Mahindra Group announced a fresh Rs 9bn investment in electric
vehicles (EVs) over the next four years, which should ramp up its first installed
capacity to 5,000 units a month.
Company has already invested Rs 6bn in EVs over the past five-six years and have
announced decided to invest Rs 4bn in Karnataka and Rs 5bn in Maharashtra over
the next four-five years. This will be used for capacity, technology and products.
Economic and Political News
Government extends transmission charge waiver for solar, wind power till
2022
Suresh Prabhu says 40% of country's GDP to come from exports by 2025
Uttar Pradesh public debt of Rs 4.43 trillion exceeds Annual Budget 2018
Corporate News
JSW Energy inks pact with Maharashtra to set up manufacturing unit for EVs
Mahindra Group to invest Rs 9bn more into electric vehicle venture
Tata Steel, JSW-Piramal joint venture bid for debt-laden Bhushan Steel
JSW Steel's 12-mn-tonne plant hits land transfer roadblock from forest
department
Market Outlook
February 20, 2018
Top Picks
Market Cap
CMP
Target
Upside
Company
Rationale
(` Cr)
(`)
(`)
(%)
Strong growth in domestic business due to its leade`hip
in acute therapeutic segment. Alkem expects to launch
Alkem Laboratories
26,005
2,175
2,441
12.2
more products in USA, which bodes for its international
business.
Favorable outlook for the AC industry to augur well for
Cooling products business which is out pacing the
Blue Star
6,964
726
867
19.4
market growth. EMPPAC division's profitability to
improve once operating environment turns around.
With a focus on the low and medium income (LMI)
consumer segment, the company has increased its
Dewan Housing Finance
17,151
547
712
30.2
presence in tier-II & III cities where the growth
opportunity is immense.
Loan growth is likely to pick up after a sluggish FY17.
Lower credit cost will help in strong bottom-line growth.
Karur Vysya Bank
8,086
111
160
43.8
Increasing share of CASA will help in NIM
improvement.
High order book execution in EPC segment, rising B2C
KEI Industries
2,938
375
436
16.3
sales and higher exports to boost the revenues and
profitability
Expected to benefit from the lower capex requirement
Music Broadcast
2,005
351
475
35.2
and 15 year long radio broadcast licensing.
Massive capacity expansion along with rail advantage
Navkar Corporation
2,528
168
265
57.8
at ICD as well CFS augur well for the company
Strong brands and distribution network would boost
Siyaram Silk Mills
3,055
652
851
30.6
growth going ahead. Stock currently trades at an
inexpensive valuation.
Market leadership in Hindi news genre and no.
2
viewership ranking in English news genre, exit from the
TV Today Network
2,865
480
560
16.6
radio business, and anticipated growth in ad spends by
corporate to benefit the stock.
After GST, the company is expected to see higher
volumes along with improving product mix. The Gujarat
Maruti Suzuki
2,64,023
8,740
10,619
21.5
plant will also enable higher operating leverage which
will be margin accretive.
We expect loan book to grow at 24.3% over next two
GIC Housing
2,093
389
655
68.6
year; change in borrowing mix will help in NIM
improvement
We expect CPIL to report net Revenue/PAT CAGR of
~17%/16% over FY2017-20E mainly due to healthy
7,070
318
400
25.7
growth in plywood & lamination business, forayed into
Century Plyboards India
MDF & Particle boards on back of strong brand &
distribution network.
We expect sales/PAT to grow at 13.5%/20% over next
LT Foods
3,040
95
128
34.7
two years on the back of strong distribution network &
addition of new products in portfolio.
We expect financialisation of savings and increasing
Aditya Birla Capital
36204
164
230
39.0
penetration in Insurance & Mutual fund would ensure
steady growth.
We expect HSIL to report PAT CAGR of ~15% over
FY2017-20E owing to better improvement in operating
HSIL
3081
426
510
16.4
margin due price hike in container glass segment,
turnaround in consumer business.
Source: Company, Angel Research
Market Outlook
February 20, 2018
Fundamental Call
Market Cap
CMP
Target
Upside
Company
Rationale
(` Cr)
(`)
(`)
(%)
CCL is likely to maintain the strong growth trajectory
CCL Products
3,808
286
360
25.8
over FY18-20 backed by capacity expansion and new
geographical foray
We forecast Nilkamal to report top-line CAGR of ~9%
to `2,635cr over FY17-20E on the back of healthy
Nilkamal
2,539
1,702
2,178
28.0
demand growth in plastic division. On the bottom-line
front, we estimate ~10% CAGR to `162cr owing to
improvement in volumes.
We expect sales/PAT to grow at 9%/14% over next two
years on the back of healthy demand growth in
Shreyans Industries
223
161
247
53.1
printing. Further, China had banned making paper
from waste pulp which would benefit Indian paper
companies.
The prism has diversified exposure in the different
segment such as Cement, Tile & ready mix concrete.
Prism Cement
5,970
119
160
34.9
Thus we believe, PCL is in the right place to capture
ongoing government spending on affordable housing
and infrastructure projects.
Source: Company, Angel Research
Market Outlook
February 20, 2018
Key Upcoming Events
Global economic events release calendar
Bloomberg Data
Date
Time Country
Event Description
Unit
Period
Last Reported
Estimated
Feb 20, 2018
8:30 PMEuro Zone
Euro-Zone Consumer Confidence
Value
Feb A
1.30
1.00
Feb 21, 2018
2:00 PMGermany
PMI Services
Value
Feb P
57.30
57.00
8:30 PMUS
Existing home sales
Million
Jan
5.57
5.62
2:00 PMGermany
PMI Manufacturing
Value
Feb P
61.10
60.50
3:00 PMUK
Jobless claims change
% Change
Jan
8.60
Feb 22, 2018
12:30 PMGermany
GDP nsa (YoY)
% Change
4Q F
2.30
2.30
7:00 PMUS
Initial Jobless claims
Thousands
Feb 17
230.00
230.00
Feb 23, 2018
3:00 PMUK
GDP (YoY)
% Change
4Q P
1.50
1.50
3:30 PMEuro Zone
Euro-Zone CPI (YoY)
%
Jan F
1.30
1.30
Feb 26, 2018
8:30 PMUS
New home sales
Thousands
Jan
625.00
646.50
Feb 27, 2018
8:30 PMUS
Consumer Confidence
S.A./ 1985=100
Feb
125.40
126.00
Feb 28, 2018
2:25 PMGermany
Unemployment change (000's)
Thousands
Feb
(24.00)
6:30 AMChina
PMI Manufacturing
Value
Feb
51.30
7:00 PMUS
GDP Qoq (Annualised)
% Change
4Q S
2.60
2.60
Mar 01, 2018
3:00 PMUK
PMI Manufacturing
Value
Feb
55.30
Mar 07, 2018
3:30 PMEuro Zone
Euro-Zone GDP s.a. (QoQ)
% Change
4Q F
0.60
Mar 08, 2018
China
Exports YoY%
% Change
Feb
11.10
3:00 PMUK
Industrial Production (YoY)
% Change
Jan
-
Mar 09, 2018
6:15 PMEuro Zone
ECB announces interest rates
%
Mar 8
-
7:00 AMChina
Consumer Price Index (YoY)
% Change
Feb
1.50
7:00 PMUS
Change in Nonfarm payrolls
Thousands
Feb
200.00
200.00
7:00 PMUS
Unnemployment rate
%
Feb
4.10
4.10
Mar 12, 2018
5:30 PMIndia
Industrial Production YoY
% Change
Jan
7.10
Mar 13, 2018
6:00 PMUS
Consumer price index (mom)
% Change
Feb
0.50
Source: Bloomberg, Angel Research
Market Outlook
February 20, 2018
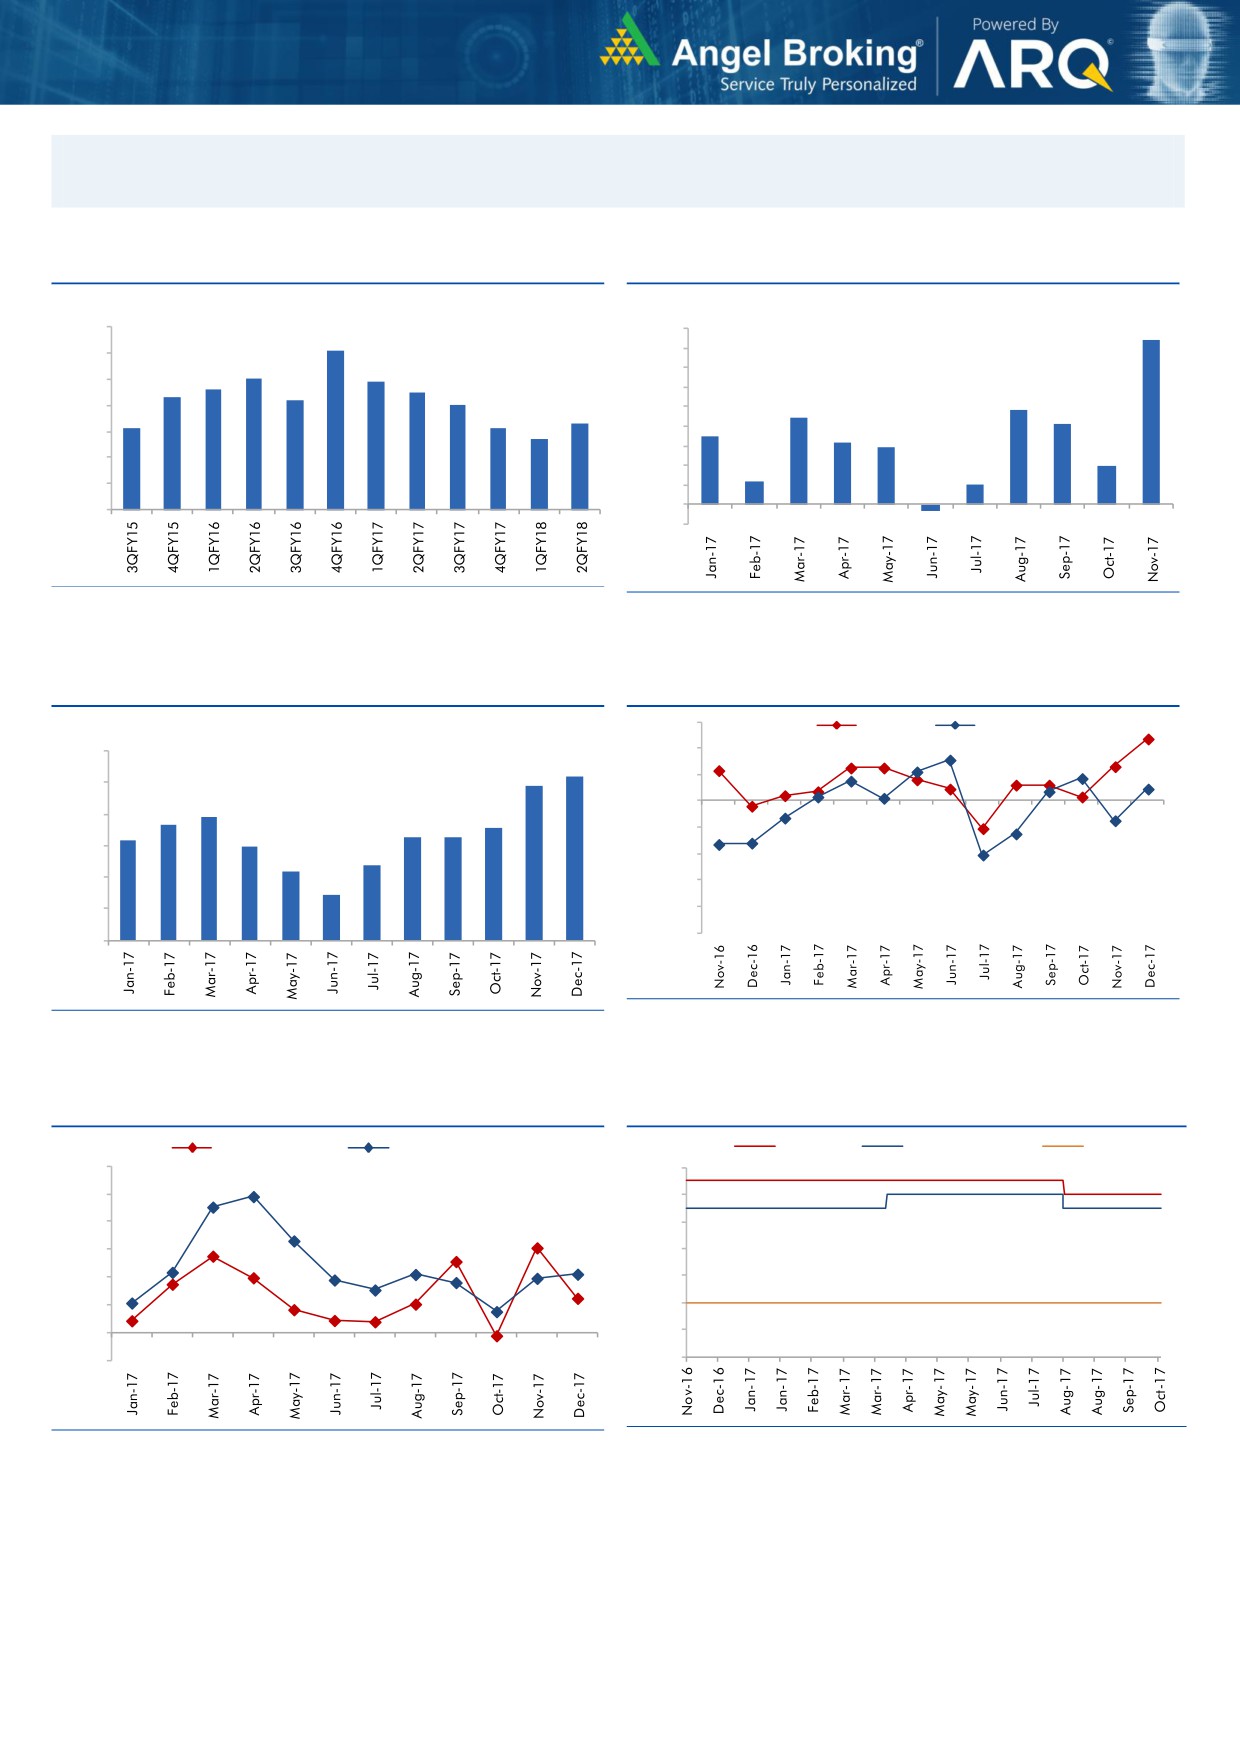
Macro watch
Exhibit 1: Quarterly GDP trends
Exhibit 2: IIP trends
(%)
(%)
10.0
9.0
8.4
9.1
9.0
8.0
8.0
7.9
7.0
7.6
7.5
8.0
7.3
7.2
7.0
6.0
4.8
7.0
6.3
5.0
4.4
4.1
6.1
6.1
5.7
3.5
3.2
6.0
4.0
2.9
3.0
2.0
5.0
2.0
1.2
1.0
4.0
1.0
-
3.0
(1.0)
(0.3)
Source: CSO, Angel Research
Source: MOSPI, Angel Research
Exhibit 3: Monthly CPI inflation trends
Exhibit 4: Manufacturing and services PMI
56.0
Mfg. PMI
Services PMI
(%)
6.0
54.0
5.2
4.9
52.0
5.0
3.9
50.0
3.7
3.6
4.0
3.3
3.3
3.2
3.0
48.0
3.0
2.4
2.2
46.0
2.0
1.5
44.0
1.0
42.0
40.0
-
Source: Market, Angel Research; Note: Level above 50 indicates expansion
Source: MOSPI, Angel Research
Exhibit 5: Exports and imports growth trends
Exhibit 6: Key policy rates
(%)
Exports yoy growth
Imports yoy growth
(%)
Repo rate
Reverse Repo rate
CRR
60.0
6.50
50.0
6.00
40.0
5.50
30.0
5.00
20.0
4.50
10.0
4.00
0.0
3.50
(10.0)
3.00
Source: Bloomberg, Angel Research
Source: RBI, Angel Research
Market Outlook
February 20, 2018
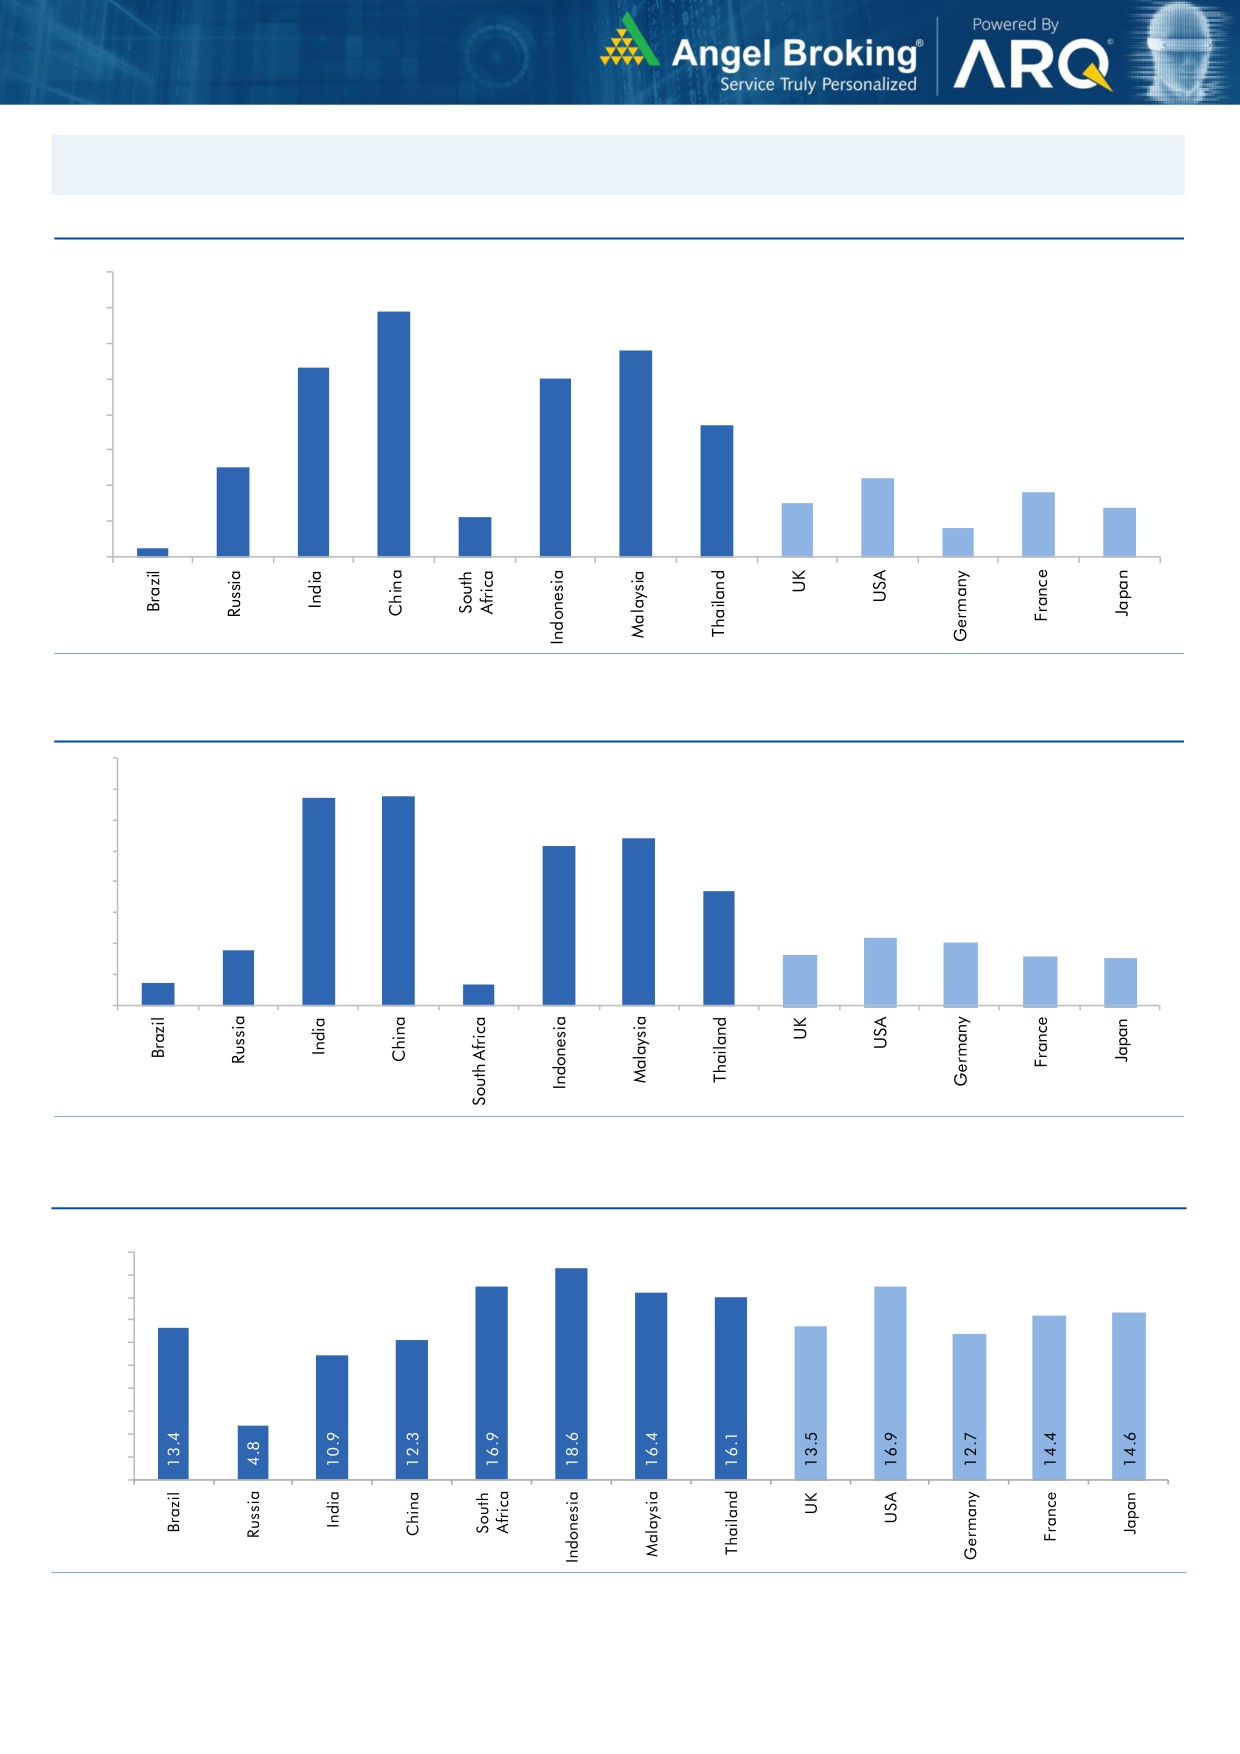
Global watch
Exhibit 1: Latest quarterly GDP Growth (%, yoy) across select developing and developed countries
(%)
8.0
6.9
7.0
5.8
6.0
5.3
5.0
5.0
1.1
3.7
4.0
2.5
3.0
2.2
1.8
2.0
1.5
1.4
0.8
1.0
0.3
-
Source: Bloomberg, Angel Research
Exhibit 2: 2017 GDP Growth projection by IMF (%, yoy) across select developing and developed countries
(%)
6.7
6.8
7.0
6.0
5.4
5.2
5.0
3.7
4.0
3.0
1.8
2.2
2.0
1.7
1.6
2.0
0.7
1.5
0.7
1.0
-
Source: IMF, Angel Research
Exhibit 3: One year forward P-E ratio across select developing and developed countries
(x)
20.0
18.0
16.0
14.0
12.0
10.0
8.0
6.0
4.0
2.0
-
Source: IMF, Angel Research
Market Outlook
February 20, 2018
Exhibit 4: Relative performance of indices across globe
Returns (%)
Country
Name of index
Closing price
1M
3M
1YR
Brazil
Bovespa
84,793
6.3
16.3
30.8
Russia
Micex
2,255
(1.9)
5.7
6.0
India
Nifty
10,378
(3.0)
1.6
18.0
China
Shanghai Composite
3,199
(6.2)
(6.0)
(0.5)
South Africa
Top 40
51,717
(4.2)
(3.1)
13.7
Mexico
Mexbol
48,928
(1.6)
2.2
3.7
Indonesia
LQ45
1,128
2.2
13.3
26.7
Malaysia
KLCI
1,857
1.7
6.9
10.0
Thailand
SET 50
1,175
(0.7)
9.3
18.6
USA
Dow Jones
25,219
(3.4)
7.7
22.3
UK
FTSE
7,248
(5.9)
(1.9)
(0.4)
Japan
Nikkei
22,149
(7.2)
(1.0)
14.3
Germany
DAX
12,386
(6.7)
(5.1)
4.7
France
CAC
5,256
(4.3)
(1.5)
7.5
Source: Bloomberg, Angel Research p68in4
Market Outlook
February 20, 2018
Research Team Tel: 022 - 39357800
DISCLAIMER
Angel Broking Private Limited (hereinafter referred to as “Angel”) is a registered Member of National Stock Exchange of India
Limited,Bombay Stock Exchange Limited and Metropolitan Stock Exchange Limited. It is also registered as a Depository Participant with
CDSL and Portfolio Manager with SEBI. It also has registration with AMFI as a Mutual Fund Distributor. Angel Broking Private Limited is a
registered entity with SEBI for Research Analyst in terms of SEBI (Research Analyst) Regulations, 2014 vide registration number
INH000000164. Angel or its associates has not been debarred/ suspended by SEBI or any other regulatory authority for accessing
/dealing in securities Market. Angel or its associates/analyst has not received any compensation / managed or
co-managed public offering of securities of the company covered by Analyst during the past twelve months.
This document is solely for the personal information of the recipient, and must not be singularly used as the basis of any investment
decision. Nothing in this document should be construed as investment or financial advice. Each recipient of this document should make
such investigations as they deem necessary to arrive at an independent evaluation of an investment in the securities of the companies
referred to in this document (including the merits and risks involved), and should consult their own advisors to determine the merits and
risks of such an investment.
Reports based on technical and derivative analysis center on studying charts of a stock's price movement, outstanding positions and
trading volume, as opposed to focusing on a company's fundamentals and, as such, may not match with a report on a company's
fundamentals. Investors are advised to refer the Fundamental and Technical Research Reports available on our website to evaluate the
contrary view, if any.
The information in this document has been printed on the basis of publicly available information, internal data and other reliable
sources believed to be true, but we do not represent that it is accurate or complete and it should not be relied on as such, as this
document is for general guidance only. Angel Broking Pvt. Limited or any of its affiliates/ group companies shall not be in any way
responsible for any loss or damage that may arise to any person from any inadvertent error in the information contained in this report.
Angel Broking Pvt. Limited has not independently verified all the information contained within this document. Accordingly, we cannot
testify, nor make any representation or warranty, express or implied, to the accuracy, contents or data contained within this document.
While Angel Broking Pvt. Limited endeavors to update on a reasonable basis the information discussed in this material, there may be
regulatory, compliance, or other reasons that prevent us from doing so.
This document is being supplied to you solely for your information, and its contents, information or data may not be reproduced,
redistributed or passed on, directly or indirectly.
Neither Angel Broking Pvt. Limited, nor its directors, employees or affiliates shall be liable for any loss or damage that may arise from
or in connection with the use of this information.